After elaborating on the theoretical concept of circular economy, the question arises how to measure circularity or the progress towards a more circular economy. Measuring circularity is essential because it shows what your company’s position is and gives a reference point for comparison and improvement. You can't measure progress in circularity with the progress indicators from the linear economy. Here is a handhold to monitor progress in transition in the meantime.
Let’s explore some approaches on company level
As a short intro we need to stay alert for the risks associated to one single score indicator. As for all key performance indicators (KPIs), it is important to select a well balanced set of targets. If a company’s only KPI is turnover, the entire organisation will make this indicator grow while the overall company’s health might be endangered. We all know that choosing KPIs need to be done wisely.
This leads us to the question. Is there a set of indicators available to measure circularity?
The purpose of circular economy is to allow products and materials to retain their value for as long and as fully as possible while at the same time creating value. By more and longer use of product functionalities the circular economy aims at value creation at the same time. Measuring the progress should reflect this.
Using products longer, reuse them, repair and upgrade the products and components, repurpose the parts, … they all have in common that the amount of materials (resources) does not increase and that service (labour) is required to provide the extended product or component functionality.
On a macro-level it becomes ‘easy’ to define valuable metrics. Essentially, measuring more wealth and jobs from less resources requires only two metrics (as introduced by Walter R. Stahel in ‘The Circular Economy A User’s Guide’):
- €/kg ( value per mass)
- h/kg (labour (jobs)/mass)
On macro-level policies might (one day) use this type of indicators to help to measuring CE progress.
Can this approach be translated into useful company metric?
The challenge for manufacturing companies is to translate this concept into an economically sound metric that combines circularity progress with economic viability.
The first macro indicator - value per mass (€/kg) - might still stand on company level. What do you earn per kg material you originally sourced? If you have an idea of the mass balance of your company (for the most important resources) this metric can be calculated and used for different business models. It is clear that the longer you have access to your product, the more opportunities for service and thus value can potentially be realized.
One major challenge is to integrate a relevant time horizon. A good starting point is to use the product life time as a referral point.
Derived metrics such as income or value/product can in this perspective become more than a traditional margin on the sold product. It might be extended to a cumulative income over the product's life time. Obviously it becomes more than a company's internal short-time metric. It requires market information (number of products on the market, number of products in use, service interventions, repairs, upgrades, redistribution of products, traceability, ….) and above all, a new relation with the customers.
The product type and business model used will have a great impact. Probably a metric per circular strategy needs to be examined. Measuring the circular effectiveness of remanufacturing activities will require another approach than the sales of consumables, and again another for a product as a service model approach. So the clue to define a decent set of circular KPIs is a combination of your circular strategy, the value per mass concept and the product life time.
The second macro indicator - jobs per mass (h/kg) - is much harder to translate to a single company. It is counter-intuitive since it might be perceived as a cost per mass instead of a CE progress indicator. Labour costs receives significantly more attention than materials cost. However in manufacturing industry the material cost is 50 to 60 % of the total cost. This means material costs are higher than labour and energy costs combined.
In the linear economy the labour cost is 'overrated' compared to the materials and resource cost, which is often perceived as uninfluential. By competing on product sales price in a global resource market this focus on labour became the logic.
Moving towards a more circular economy, other effects gain importance. For servicing and after sales operations on the physical goods skilled labour is required. This might be additional to the current labour from manufacturing, but in the long run a shift from production labour to service labour might occur. Combine a saturated market with the need for product life time extension and this shift might be happening right now. This indicator can be seen as how much material and resources are required to create labour and jobs. A company might decide to strive to provide functionality to its customers without the need for more resources. Ideally a company can provide the functionality by aiming at dematerialisation. Example: if hardware is required to provide functionality, one can strive to deliver this value by only using software. Doing so, the sky is the limit for this indicator, since service manhour might increase somewhat while the mass required (kg) drops to almost zero.
How to realise this in practice?
Front running companies define KPIs on the company level targets like x% of sales from circular products and services, Y% of operational waste recycled, no waste to landfill, closed loops for the dedicated products or resources, … So additional targets are defined in line with the circular strategy defined per product group.
Some of those companies measure now already the installed product base (products installed and in use in the market) based on sales data, tracking, data from service providers, … In combination with a remanufacturing strategy additionally figures are collected on the amount of the known installed products that are reworked, upgraded or remanufactured by competitors. Additionally the reuse rate of parts for remanufactured are measured and compared to the installed base products outflow. On the one hand these companies have access to a large quantity of data, but on the other hand, they also miss information that was not important in the linear economy. So these companies already have a fairly good view on how many euros per kilo of product they urn and evidently also on the impact this will have on employment.
Similarly for product-as-a-service models the installed base expressed in product performance (use time, light output, kilometres, ...) over time (performance/year) of the products is related to the virgin material mass applied. When upgrades are made (software or hardware) the material impact in relation to the sold performance is measured. End of contract products that are redistributed, reused or sold add to the income side of metric without impacting the materials consumption (the mass part of the metric). Here too, a large quantity of data is missing, but they already have an indication of circularity too.
What steps can you take ?
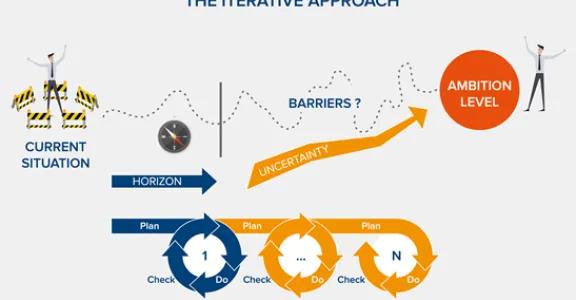
The above approach illustrates that measuring the circularity of your company activities requires a new broad approach. It requires insights in customer relations, collaboration with partners for data gathering, product servicing, purchasing, production, sales, product design, … This complexity should not stop you. Frontrunning companies embrace this complexity because it allows them to explore new business opportunities and activities. It provides more degrees of freedom, install new services, set up new partnerships, get access to valuable data, … Companies making good progress start by defining meaningful metrics and in a second phase they improve how they can get the figures, find more accurate data, … Doing so, the strategical targets stay on the radar and you navigate your company to the desired direction.
For sure, you will need also the well balanced economic indicators that might already be in place now. One day a new set of costing tools will be required to prevent that CE metrics compete with metrics designed for the linear model. (See also our blog on externalities). Therefore it is almost impossible to define metrics if you still operate with both linear and circular goals. More precisely running both linear an circular strategies, which is often inevitable during the transition, requires a double set of indicators.
This is why transitional progress indicators and project control instruments deserve a place. Project management tools and indicators are well known and are required to manage for circular projects. Transitional progress is harder to measure and control. However a key idea is that doing more of the same (business as usual) is to be avoided while experimenting, questioning and learning are basic ingredients.
To support manufacturing companies in measuring their CE progress we created the Cesar Tool. This free web-based tool allows to score on a semi-quantitative manner how your company grasps the opportunities related to each product life cycle. Multiple aspects related to the new complex circular product value delivery, creation and capture form part of this explorative evaluation. Feel free to try it by using this link.
Want to know more or need some support to speed up your process? Contact us. We’ll find out which supporting initiative fits best with your needs.
]]>


