In a new series of blogposts we unravel the circular economy, connecting theory with practical examples and best practices.
As mentioned in the introduction to our series, global versus local is observed by many actors in the manufacturing industry. In a blogpost with the insights of our Industry 4.0 colleagues related to the impact of Covid-19 we have already highlighted the impacts on the supply chain. Summarized, to improve supply security resilience needs to be improved, which might lead to new ways of strategic sourcing, partially by choosing for suppliers closer to the geographical markets and operations.
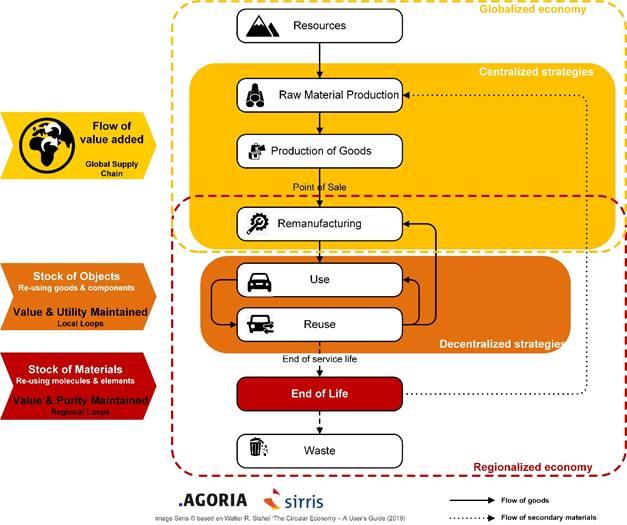
In this blogpost we want to approach this topic from a circular economy perspective. The well-known butterfly diagram visualizing the circular economy is a good starting point to explore the value circles in relation to the geographical activities.
On the left hand side of the butterfly diagram biobased materials and food are represented. In our globalised market we largely depend on production and supply from outside Europe. This is possible since a large set of costs are externalized and not integrated in the product cost. On the one hand, we buy cheap nutrients and food from all over the world while the cost of, for instance, deforestation (where applicable) is not taken into account. On the other hand, the by-products often have a lower market value. In many cases less regulation (compared to technical materials waste and side streams) applies, which makes collection, transport preprocessing challenging to be organised on a large international scale. Searching for more local preprocessing and value delivery becomes interesting. Examples are the Belgian concentrated potatoes production and the side streams thereof, and the flax side streams that are upgraded locally before being exported as a valuable resource for textile products in the Far East.
Looking at the technical life cycles two categories can be identified. Walter Stahel calls them the era of R and the era of D.
-
The era of R stands for Reuse, Remanufacture, Repair, etc, or the management of products, parts and goods.
-
The era of D stands for Depolymerise, De-alloy, De-vulcanise, etc, or the management of stocks of atoms and molecules.
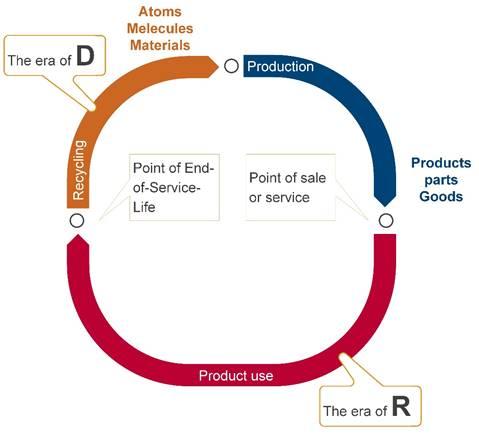
Figure by Sirris based on W. Stahel's
By examining those two groups we can identify different value drivers and as a result different ways to capture this value from a circular perspective.
In the era of D, where all the recycling activities are situated, operations are in general currently organized on a larger scale due to the relative low or negative value of the materials. In some cases the legislative context makes collection and recycling viable, for instance organized through collective collection and recycling schemes (such as Recupel and Bebat).
So per weight unit (kg, ton) the value is low, which requires larger installations to create cost effective recycling operations with a sustainable business case. The value opportunities here are more likely to be found in larger scale operations. As a result, in general larger companies invest in this type of value creation. Finding the niche by improved sorting, separation, … might be an opportunity for smaller and local companies who might decontaminate, ‘revalorize’ or upgrade side streams that might become interesting for high quality recycling operations. Some side streams might even contain a high value material for specific ‘design from recycling’ products. This illustrates that finding a market is at least as important as assuring the incoming material streams. The four key elements are: effective collection, good sorting quality, high recycling efficiency and a large market demand.
In the era of R we observe different value flows. These activities of remanufacturing, upgrading, reusing, refurbishing, redistribution, … require other types of activities and organization. While the era of D is largely built on the automation of processes, the era of R is built on services requiring knowledge, experience, competences which are much harder to automate. Often a human intervention on the product, part or component is required to realize the value-adding service. Following this perspective indicates that these activities are more locally organized or at least locally performed. The potential value is higher per mass of material (kg, ton) but might be hard to capture due to the often dispersed product install base or the geographically scattered product users. Capturing this value will in many cases require collaboration to allow cost-effective service organization and execution.
Knowing this, how can companies become more resilient?
Getting an idea of the business risks related to current product portfolio might be wise. The supply perspective will be relatively easy but for many companies the risks related to the value creation and value capture perspective might be more challenging.
As an example we look at the covid19 impact for two companies with almost identical products, but with very different product design and market approach. The first company’s supply chain heavily depends on semi-finished products from the Far East and it sells products to one dedicated customer segment. It is in 'normal' times a well performing and effective organisation. The other company designs and produces its products from scratch and depends on parts supply mainly from the Far East. They have a broad product portfolio and deliver products as well as services to multiple customer segments. The impact of the heavily disrupted supply chain and market due to covid19 had very different effects on both companies. The first one was hit twice. Once by the lack of supply and secondly by the diminishing demand. The second company was somewhat less dependent from Far East supplies and could easier find alternative supplies. Secondly and more importantly, the decline in demand from some customer segments was more than compensated by the increased demand by other customer segments. Their turnover even overshoots the targets made in the beginning of the year.
Balancing between unlimited globalisation and local or regional networks is necessary. Often, a certain complexity and multiple interlinkages in and between organisations improve resilience to disruptions, which we will face even more often in the future.
A good starting point is mapping the value ecosystem.
Make sure that you have a clear vision of the value chain and the stakeholders involved in the life cycle of your products. Drawing a map with all actors involved and the value adding activities they perform is a good starting point. In a next step you can link the insights from the ecosystem to the good practices, knowledge, capabilities and experiences your company has, to find value adding activities that support product life time extension.
Want to know more? Contact us!
In a few weeks we will launch a tool that will help you to take the circular economy a step further.
(Source picture at the top: https://nl.dreamstime.com)
]]>